
Case Study
Sellozo
Web Design & UI/UX for Amazon Advertising Platform

Project Overview
Sellozo, an innovative AI-driven Amazon advertising automation platform, approached us to redesign their web interface and user experience. Despite having powerful technology, their existing platform was complex, creating a high learning curve for new users and limiting user adoption. The challenge was to create a more intuitive interface that would showcase their sophisticated features while maintaining accessibility for users of all skill levels.
Our team delivered a comprehensive UI/UX redesign that simplified the user journey, created a more intuitive visualization of complex data, and developed a streamlined onboarding process. The result was a platform that effectively balanced powerful functionality with ease of use, significantly improving user engagement and satisfaction while effectively communicating Sellozo's competitive advantages in the Amazon advertising space.
Project Details
Client Industry
E-commerce SaaS / Amazon Advertising
Services Provided
Web Design, UI/UX, Information Architecture
Project Timeline
14 Weeks
Website
sellozo.comThe Challenge
- Complex interface that overwhelmed new users with too many options
- Difficulty in visualizing complex advertising data relationships
- Steep learning curve for users new to Amazon advertising
- Website wasn't effectively communicating the platform's value proposition
- Inconsistent design elements across different tool sections
Our Solution
- Streamlined interface with a focus on progressive disclosure of advanced features
- Intuitive drag-and-drop Campaign Studio for visualizing ad relationships
- Guided onboarding process with interactive tutorials and tooltips
- Data visualization redesign to highlight key metrics and actionable insights
- Unified design language across platform tools and marketing website
Our Design Process
Research
Conducted user interviews with current Sellozo customers and Amazon sellers to identify pain points in the existing interface and needs for the redesign.
Information Architecture
Reorganized the platform structure to create logical workflows that align with how Amazon sellers approach advertising management.
Visual Design
Created a modern, clean interface that balances data density with usability, focusing on visualizing complex advertising relationships.
Initial wireframes for the Campaign Studio interface
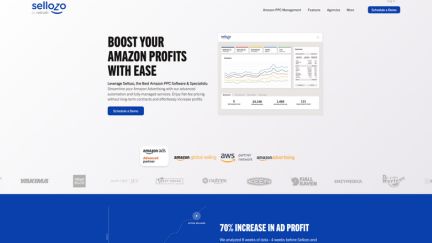
Final design with intuitive drag-and-drop campaign management
UI/UX Strategy & Implementation
Key Interface Improvements
Our research identified that users were struggling most with visualizing and understanding the complex relationships between different Amazon advertising campaigns. By focusing on intuitive visualizations and progressive disclosure of information, we created a more accessible experience that still maintains powerful functionality.
| Interface Element | Before | After | User Impact |
|---|---|---|---|
| Campaign Management | Text-based list view with complex filtering | Visual drag-and-drop interface with relationship mapping | 85% reduction in time to create campaign relationships |
| Dashboard | Data-heavy with overwhelming metrics | Focused on KPIs with progressive drill-down capabilities | 42% increase in daily dashboard engagement |
| Keyword Management | Manual process with multiple steps | Automated keyword harvesting with visual flow | 73% reduction in keyword management time |
| Analytics View | Tabular data with limited visualization | Interactive charts with customizable views | 68% improvement in data comprehension |
| Onboarding Process | One-size-fits-all orientation | Personalized based on user experience level | 58% increase in new user activation rate |
User Experience Enhancements
- Implemented customizable dashboard with user-specific KPI focus
- Created Campaign Studio with visual campaign relationship builder
- Developed ProductVu for analyzing product performance with clear metrics
- Added interactive tooltips and contextual help throughout the interface
- Designed responsive layouts that work across desktop and tablet devices
Technical Implementation
- Built scalable component library for consistent design across platform
- Implemented advanced data visualization with D3.js for interactive reports
- Created drag-and-drop functionality for campaign management
- Optimized for performance with lazy loading and efficient data handling
- Integrated with Amazon's Advertising API for real-time data accuracy
Results & Impact
Increase in user engagement with platform features
Reduction in new user onboarding time
Increase in trial-to-paid conversion rate
User Satisfaction Improvement
| Metric | Before | After | Improvement |
|---|---|---|---|
| User Satisfaction Score | 6.2/10 | 8.9/10 | +43.5% |
| Net Promoter Score | +12 | +47 | +35 points |
| Feature Discovery | 34% | 82% | +141% |
| Support Ticket Volume | 145/week | 63/week | -57% |
| Task Completion Rate | 68% | 94% | +38% |
Ready to transform your digital presence?
Let's discuss how we can help your business achieve similar results.
Schedule a Free Consultation